Introduction
Unlike mono-functional Grey infrastructure, Nature-based Solutions are multi-functional, and as such they deliver benefits across a series of urban challenges for a number of stakeholders. In fact, alternative NBS that can be implemented in an urban context will have a different set of beneficiaries.
So this raises the following question: which Grey or NBS option we should choose to capture the maximum value potential and who will benefit most from these interventions? In addition, would the selected option have the highest cost-benefit?
While valuation methodologies do exist, projects typically give limited attention to this activity or have limited capacity to apply them. This results in a limited awareness of decision and policy makers of the Total Economic Value [1] (TEV) of NBS.
In this Zoom-In article, we explore how methods of economic valuation and cost-benefit analysis can be applied to assess the value proposition of Blue-Green roofs of Amsterdam [2]. First, some basic concepts are described to explain the rationale behind the analysis. In particular, we discuss how climate uncertainty (how different impacts arise for a low or high emissions scenarios) can have an impact on the cost-benefit assessment. Lastly, we discuss the implications CBAs can have on the upscaling of blue-green roofs across the city of Amsterdam.
Concepts and Methods
Total Economic Value (TEV) framework
Environmental economists will tell you that before you make your final infrastructure selection you should perform a thorough economic analysis across option. Total Economic Value is a well suited framework for this sort of analysis. Essentially, TEV is used for classifying ecosystem goods and services in order establish their value. TEV encompasses use values and non-use values (see Figure 1).[3] Use value is comprised by three different value categories (not necessarily all present in all NBS projects):
- Direct use value: good and services that are used directly by humans, including consumptive uses (e.g. food products, material for construction) and non-consumptive uses (e.g. enjoyment for recreation and cultural activities)
- Indirect use value: the values derived from the ecosystem services that benefit outside the ecosystem itself, e.g. flood protection, water filtration, carbon sequestration
- Option value: derived from preserving the option to use in the future ecosystem goods and services that may not be used at present; these can be provisioning, regulating or cultural services as described in the previous categories
Non-use value, also known as existence value, is the value that people enjoy merely by knowing the resource exists even if they never intent to use it themselves.
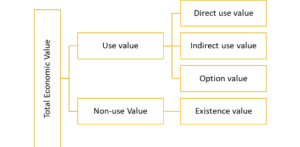
Figure 1. Total Economic Value – reproduced by IUCN, TNC, World Bank (2004)
Economic valuations
A typical economic valuation would follow a series of steps for each alternative infrastructure option:
- Step 1. The identification of the full spectrum of benefits that the NBS can provide
- Step 2. The quantification of these benefits, i.e. how much of each benefit is actually ‘delivered’?
- Step 3. The performance of the valuation to express them in monetary terms
It is worth noting that the supply of an NBS service does not necessarily have an equal demand and the benefit is only potential, e.g. the availability of recreation areas does not translate in value if there is no direct use of it.
Two primary methods exist for a monetization exercise: firstly, the revealed preference methods which use observable choices on markets, and, secondly, stated preference methods which are used when no market of goods exist or consumer choices cannot be directly observed. In the latter case, the ‘willingness to pay’ has to be elicited from a hypothetical market. There are several techniques to actually give a price tag on benefits for either of the methods and most of them coming with their own pros and cons. These are not discussed here but useful information can be found in Horvathova (2019) [4]. Some of these techniques are employed in the economic valuation of Amsterdam’s blue-green roofs (see below).
Cost-Benefit Assessments
Once costs and benefits have been expressed in monetary terms, a cost-benefit analysis can be performed and be used for the comparison of different sort of decisions, e.g. alternative grey and nature based solutions. For projects with long-horizons as NBS infrastructure, CBAs take into account the present value of money: money in the present is more ‘valuable’ than in the future. This is to reflect the ability to have a rate of return if money was invested elsewhere. For this reason, CBAs apply a discount rate. Along this line of thinking, spending on capital or operation expenditure tomorrow is preferred. Similarly, some benefits that will be delivered in the future (e.g. carbon sequestration by trees planted today but growing over long periods in the future) are deemed ‘less’ valuable.
As CBAs are calculation intensive and introduce many assumptions, users need to take a critical look to identify where their uncertainty sources lie. This can allow them to perform sensitivity tests to obtain a range of possible results; in this way, their findings become more robust. Lastly, cost and benefits can be reported in terms of a ratio to obtain a metric that is useful to compare across options.
Accounting for Climate Risk in CBA
One of the primary sources of uncertainty in CBAs that are performed for climate resilience infrastructure is climate change itself. A fast changing climate generating more extremes is expected to make investment in a piece of infrastructure more attractive. For instance, in the case of increasing flood frequency or intensity, damage avoided (seen from a benefit perspective) thanks to the infrastructure will be more significant/frequent than in a slow changing climate, i.e. the infrastructure will do its work more often. Conversely, in a slow changing climate, the same piece of infrastructure (identical design) would have to deal with lower frequency or intensity.
Given climate uncertainty it is not possible to identify the ideal design capacity that would minimize costs and maximize benefits. This type of nuances need to be captured by CBAs through multiple scenario testing. This is relevant in the CBA performed for Amsterdam’s blue-green roofs as shown below.
Performing a CBA for Amsterdam’s blue-green roofs.
Against the methodological background presented, RESILIO’s CBA for the blue-green roof systems involves the following steps (see Figure 2).
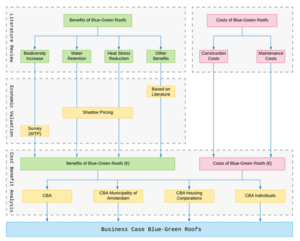
Figure 2. Benefit identification, their economic valuation through relevant techniques and cost benefit analysis for Amsterdam’s RESILIO blue-green roofs systems (produced by Floor Borstlap, Vrije Universiteit Amsterdam)
- Identification and quantification of relevant costs and benefits.
The project has made significant effort in the collection of biophysical data and execution of simulation models to make a robust quantification of costs and benefits.[5]
- Valuation of relevant benefits.
Costs can be calculated with high accuracy using relevant information from the infrastructure development. On the other hand, benefits cannot be calculated using revealed preference methods as no real-life market directly captures them. The following valuations were performed:
- Direct pricing has been applied, where direct and indirect prevented damages are obtained for climate impact models. While direct and indirect damage assessments are directly related to the benefit that blue-green roofs can offer, the assessment has considerable uncertainty.
- Shadow Pricing has been used to overcome the uncertainties of direct and indirect damage assessments. Through shadow-pricing, the avoided costs (i.e., the benefit) of implementing blue-green roofs can be assessed when they are compared to the costly alternative of water storage in the public urban environment.
- Willingness-To-Pay (WTP) has been applied using surveys to establish the value of biodiversity increase, i.e., this reflects the price citizens are willing to pay for this ecosystem service.
- Benefit transfer methods, i.e., the use of appropriate values based on literature.
It is worth noting that shadow pricing is typically used for intangible assets, i.e., something not normally priced or sold in the market, but also to put a price tag on externalities. It is therefore a suitable method for the valuation of water retention and heat stress reduction. Specifically, the hypothetical market value of these benefit is derived from the cost of alternative infrastructure that could perform the same role, i.e., a grey system holding this much water.
- Cost Benefits Analysis
In this final step, the cost and benefits are compared following the approach outlined above. The assessment can be performed for a middle and high-emission scenarios to establish in which possible future climate condition the benefits will outweigh the costs. In the ongoing analysis, results are established for the high-emissions scenario (see first findings below).
Also, although one might want to compare the cost benefit ratio of two alternative options (e.g., a grey option vs a NBS), the shadow pricing approach followed above implicitly takes this comparison into account.
First findings and implications
Figure 3 shows initial findings from the cost-benefit analysis performed in RESILIO. The range for the NPV shows the results ranging from low-cost/high-benefits to high-costs/low-benefits. While the technology used in RESILIO is still innovative and under development the discounted NPV shows the potential for a positive cost-benefit analysis. Reducing maintenance costs, achieving economy of scale, and using the roof in a multi-functional manner can tip the scale to a positive NPV under all scenarios.
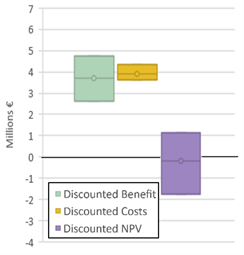
Figure 3: Discounted costs and benefits, and discounted Net Present Value
RESILIO has developed a good understanding into how sustainability criteria can be introduced in the valuation of this particular NBS intervention. It has also developed a methodology for considering climate uncertainty in a CBA. This has implications also in upscaling: as blue-green roofs form decentralized systems, the rate of their deployment can be planned to match future rate of climate change through slow or fast deployment of blue-green roofs. In essence, there is an option value in Amsterdam’s roofs which underground grey systems cannot offer.
Finally, RESILIO identified transfer mechanisms for costs and benefits. This is crucial, as the costs often lie with the roof owner, while the benefits are for society. Examples of transfer mechanisms are for instance Co-investments by stakeholders that benefit from the blue-green roofs, direct payments for maintenance by stakeholder who benefit from blue-green roofs, subsidies to stimulate the uptake of blue-green roofs This information is essential for Amsterdam in its ambition to build a business case for the RESILIO roofs.
References:
[1] Plottu, E., Plottu, B., 2007. The concept of Total Economic Value of environment: A reconsideration within a hierarchical rationality. Ecological Economics 61, 52–61.
[2] Technical aspects of the project have been presented elsewhere. Readers are recommended to acquire some basic understanding of the system. See the UIA initiative website.
[3] IUCN, NTC & World Bank, How much is an Ecosystem worth? Assessing the economic value of conservation, Washington, 2004
[4] Horvathova, 2019, An assessment of costs and benefits of nature-based solutions in cities, LIFE Tree Check
[5] Their presentation is not within the scope of this zoom-in article